
Guide for creating tables
Titles
Titles should be informative, as brief as possible, and written in a consistent manner (additional details or information should be included in the comments below the table).
If there is only one unit of measurement in the entire table, it should be included within parentheses at the end of the heading (if there are multiple units of measurement, they should be included where appropriate within the table).
Below is an example of a table title that is too long and contains unnecessary information:
| Table 1 Information and interactive features provided on social media pages of mayoral candidates in the 2010 and 2014 elections (figures are the percentage of pages with each feature) |
Here is an example of the above title with explanatory information moved to the comments below the table, and with the title properly formatted:
|
Table 1 Interactive features of mayoral candidates’ social media, 2010–2014 (per cent) Comments: N = 500. Data was collected during the elections that took place in 2010 and 2014. The figures indicate the percentage of total pages that included each feature. |
Comments and sources
If applicable, tables should have comments and a source. Include relevant information in the following manner:
Table 1 Short and concise title of table 1 (unit, if applicable)
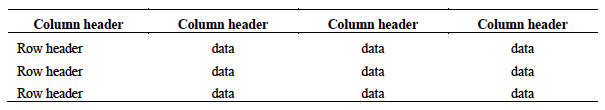
Comments: Present any general clarifying or supplementary text here, including the underlying data (e.g., N-values, survey questions, response scales, etc.). Do not repeat the header or surrounding text. There is no need to include information that is easily understood from the table.
aUse superscript lowercase letters for specific notes relating to specific elements in the table, labelled with a corresponding letter. bSubsequent notes continue in line.
*Use asterisks to indicate probability (p values), **Subsequent notes continue in line.
Source: Format like an in-text citation, but without the parentheses. Ensure there is a corresponding reference list entry
Structure
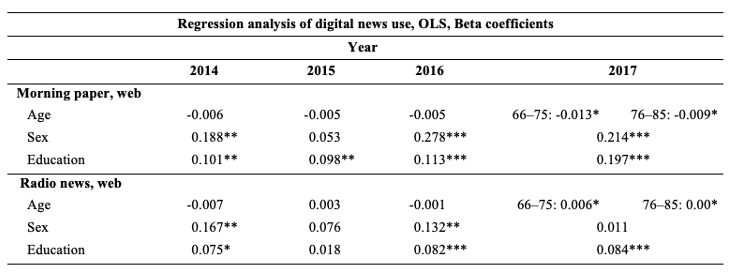
Avoid including unnecessary information in the table that could be included in the title or comments instead. Table 2a is an example of a table that looks good, but is not accessible to a screen reader.
Table 2a Table that can be easily understood by sight but will not be accessible to screen readers
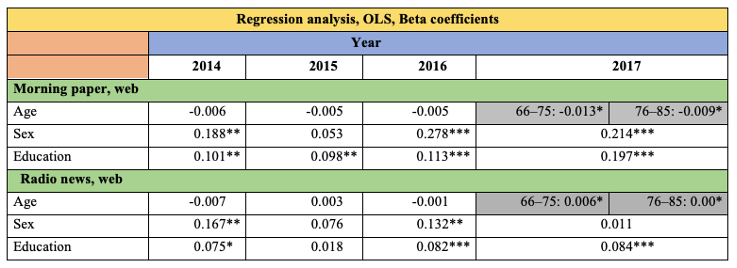
Even though Table 2a looks clear and logical to a person with sight, Table 2b shows the multiple problem areas. For example, the top header cell highlighted in yellow, which spans five columns, should be included in the comments instead. Below that, the blue header cell which spans four columns is obvious and does not need to be included at all. In addition, there are two empty, useless cells, highlighted in orange, and the grey highlighted cells show split cells after one row header. The subheaders, highlighted in green and spanning all five columns, can be difficult for some screen readers to read correctly. Instead of using headers like these, create two smaller tables instead, and include this information in the titles.
Table 2b Table showing unnecessary information and merged and split cells
Tables 3a and 3b demonstrate a more accessible and simplified option instead of the problematic structure presented in Tables 2a and 2b. The borders in Table 3a help illustrate a simple table structure with no empty, merged, or split cells. Table 3b illustrates what the final table should look like.
Table 3a Digital news use of morning papers, 2014–2017
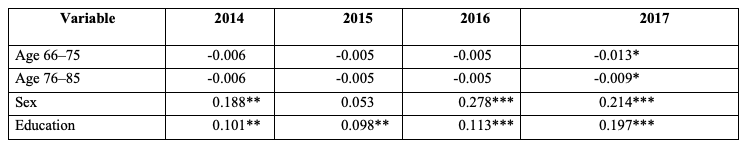
Table 3b Digital news use radio news, 2014–2017
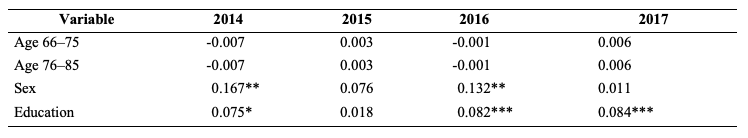
Comments: Tables 3a and 3b show an OLS (ordinary least squares) regression analysis with beta coefficients. The surveys carried out in 2014–2016 had one age group (66–85), and thus the values are the same. In 2017, age was split into two groups (66–75 & 76–85).
*p < 0.05, **p < 0.01, ***p < 0.001
Contact
If you have questions or concerns, please contact the manuscript editor at kristin.clay@nordicom.gu.se
Page last updated October 2025